Fractal Patterns
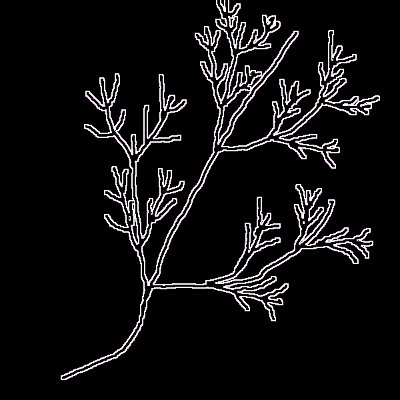
A fractal pattern is a pattern which can be said to consist of itself recursively. Imagine a simplistic tree pattern which consists of a trunk and four branches, two sticking out on the trunk's left side and two on its right. Each branch has the same pattern as the trunk; two sub-branches sticking out on its left side and on two on its right. The sub-branches again has the same pattern and so forth.
Maps
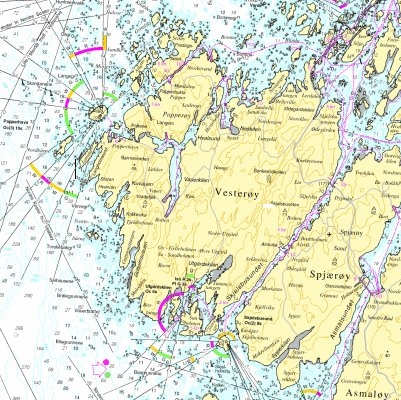
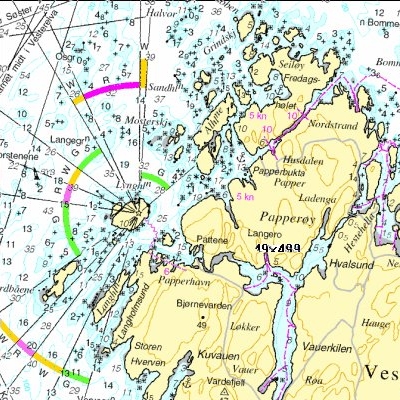
Another characteristic of a fractal pattern is that it will look the same (generally speaking) however deep you zoom in on it.
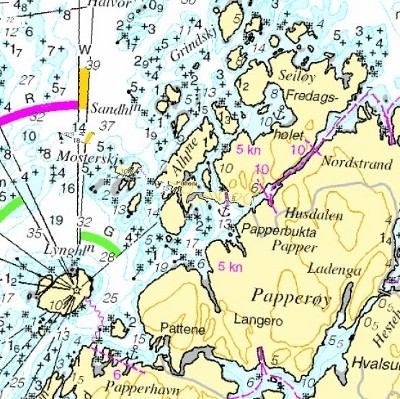
Imagine a map of a coast line. It will generally have the same pattern of bays and inlets regardless of the scale - whether the map covers 100 kilometers of the coast or just one. The sea charts under are all from the same area. They differ in scale, but share the same general pattern. They are 5, 2.5 and 1.25 nautical miles across.
Price Charts
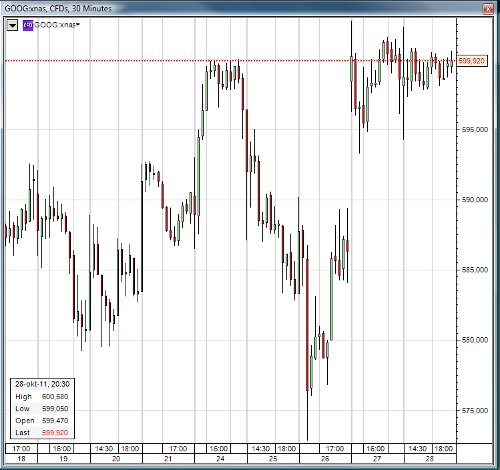
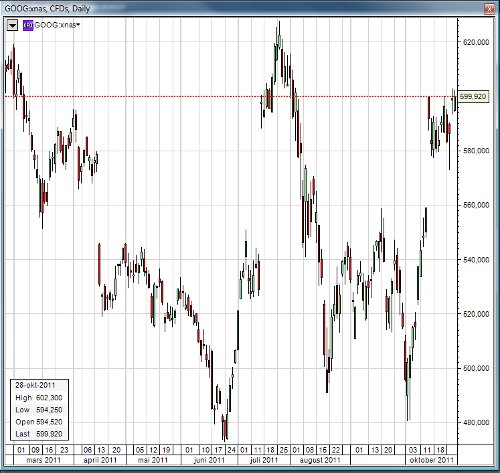
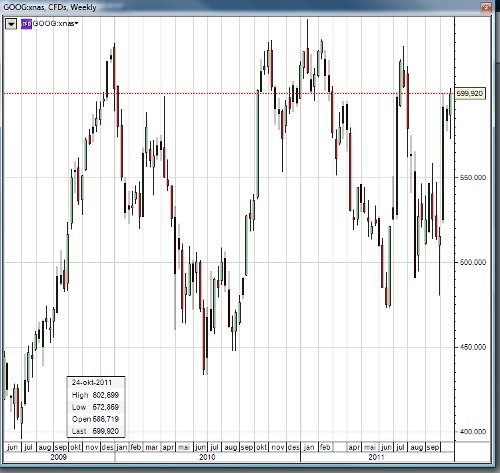
The general similarity of the three sea charts above can also be seen in price charts at different resolutions.
The candelight-type price charts for the Google stock (under), show half-hour movements, daily movements and weekly movements.
By simply looking at the general pattern of one of the charts, it is not possible to see whether its resolution is 30 minutes, 24 bours or a week.
Mathematically Derived Fractal Patterns
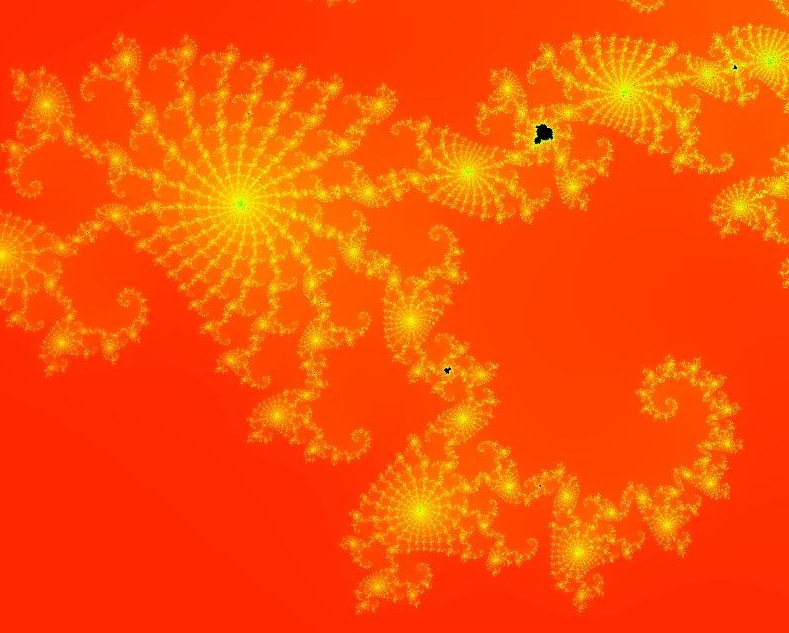
Surprisingly simple mathematical expressions can be visualized in highly complex, and sometimes, striking and beautiful fractal patterns. The pattern under is a tiny bit of a graphical visualization of the Mandelbrot set. To understand such patterns, it is necessary to look at the related mathematical concepts or the presentation of a fractal video.
